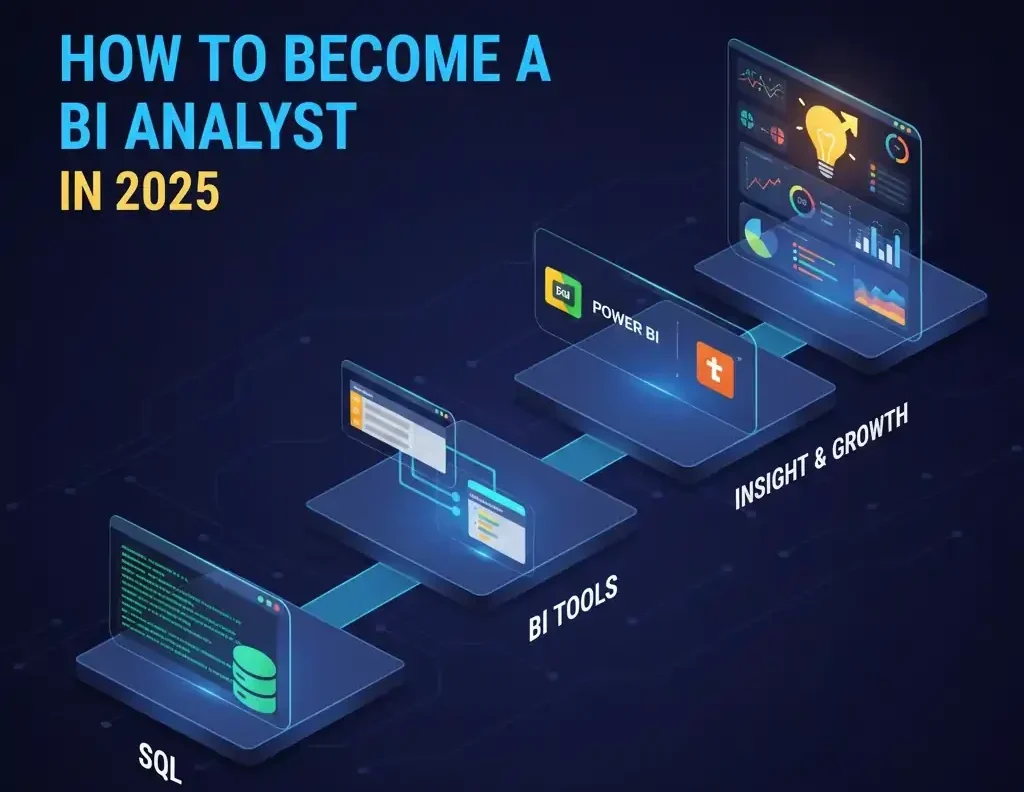
The world of business intelligence (BI) is booming. Companies are drowning in data, and they need skilled professionals to turn raw numbers into actionable insights. If you’re wondering how to become a BI analyst in 2025, you’re in the right place. This guide lays out a clear, actionable roadmap to break into this high-demand field, packed with real-world tips, stats, and stories to help you succeed.
Business intelligence analysts bridge the gap between data and decision-making. They analyze complex datasets, create dashboards, and provide insights that drive business growth. With the global BI market expected to hit $42.95 billion by 2028 (Statista), the demand for BI analysts is soaring. Ready to jump in? Let’s dive into the 10 steps to launch your business intelligence analyst career.
Table of Contents
Why Choose a Business Intelligence Analyst Career in 2025?
Before we get to the steps, let’s talk about why this career is worth pursuing. BI analysts are in high demand across industries like finance, healthcare, retail, and tech. According to Glassdoor, the average U.S. salary for a BI analyst in 2025 is around $85,000-$110,000 per year, with top earners crossing $130,000. Plus, the role offers flexibility, as many BI analysts work remotely or in hybrid setups.
The job isn’t just about crunching numbers. It’s about storytelling with data, solving real business problems, and being a key player in strategic decisions. Imagine helping a retail chain optimize inventory to save millions or guiding a healthcare provider to improve patient outcomes. That’s the power of a BI analyst.
Step 1: Understand the Role of a BI Analyst
A BI analyst’s core job is to collect, clean, and analyze data to uncover trends and insights. They use business intelligence tools like Tableau, Power BI, or Looker to create visualizations and reports. They also collaborate with stakeholders to understand business needs and translate them into data-driven solutions.
Key Responsibilities:
Collecting and cleaning data from various sources.
Building dashboards and reports for stakeholders.
Identifying trends and patterns to inform business decisions.
Communicating insights to non-technical teams.
Real-World Example: Sarah, a BI analyst at a logistics company, noticed a spike in delivery delays through her Tableau dashboards. By digging into the data, she identified a bottleneck in a specific warehouse, saving the company $500,000 annually by streamlining operations.
Step 2: Build a Strong Foundation in Data Analysis
To excel as a BI analyst, you need a solid grasp of data analysis fundamentals. Start with statistics, probability, and data manipulation techniques. These skills help you make sense of raw data and spot meaningful patterns.
Actionable Tips:
Learn Statistics: Focus on descriptive statistics (mean, median, mode) and inferential statistics (hypothesis testing, regression analysis).
Master Excel: It’s still a staple in BI. Learn advanced functions like VLOOKUP, pivot tables, and macros.
Understand Data Types: Know the difference between structured (databases) and unstructured (text, images) data.
Pro Tip: Free resources like Khan Academy offer beginner-friendly courses on statistics. Spend 10 hours a week practicing, and you’ll be confident in a month.
Step 3: Master Key BI Analyst Skills
The BI analyst skills you need go beyond technical know-how. Employers value a mix of hard and soft skills to ensure you can handle data and communicate insights effectively.
Must-Have Skills:
Technical Skills: SQL, Python or R, and BI tools (Tableau, Power BI, Qlik).
Analytical Thinking: Ability to break down complex problems.
Communication: Explaining technical insights to non-technical stakeholders.
Business Acumen: Understanding industry-specific challenges and goals.
Story: When I mentored Alex, a career-switcher from marketing, he struggled with SQL. We spent two weeks practicing queries on free datasets from Kaggle. By the end, he built a dashboard that landed him his first BI analyst role at a fintech startup.
Step 4: Learn SQL Like Your Career Depends on It
SQL (Structured Query Language) is the backbone of data analysis. It’s how you pull data from databases, which is a daily task for BI analysts. In 2025, 80% of BI analyst job postings on LinkedIn list SQL as a requirement.
How to Learn SQL:
Start with Basics: Learn SELECT, WHERE, JOIN, and GROUP BY statements.
Practice Daily: Use platforms like LeetCode, HackerRank, or Mode Analytics.
Work on Real Projects: Query public datasets (e.g., Google BigQuery’s public datasets) to simulate real-world tasks.
Actionable Tip: Set a goal to write 10 SQL queries a day for 30 days. By the end, you’ll be comfortable handling complex joins and aggregations.
Step 5: Get Hands-On with Business Intelligence Tools
Business intelligence tools are your paintbrush as a BI analyst. Tools like Tableau, Power BI, and Looker help you visualize data and create interactive dashboards. According to a 2025 Gartner report, Power BI and Tableau dominate the BI tool market with a combined 65% share.
How to Get Started:
Tableau: Start with Tableau Public (free) to build visualizations.
Power BI: Download the free desktop version and explore its DAX language.
Looker: Use Looker Studio (free) to practice creating reports.
Pro Tip: Build a portfolio project, like a sales dashboard for a fictional retail company, and publish it on Tableau Public or GitHub. Recruiters love seeing real work.
Step 6: Learn Python or R for Advanced Analysis
While SQL handles data querying, Python or R takes your analysis to the next level. These programming languages are perfect for statistical modeling, machine learning, and automating repetitive tasks.
Python vs. R:
Python: More versatile, widely used in tech, and beginner-friendly. Libraries like Pandas and Matplotlib are BI staples.
R: Great for statistical analysis and academic research but less common in industry.
Actionable Tip: Start with Python. Take a free course like “Python for Data Analysis” on Coursera, and practice on datasets from Kaggle.
Step 7: Develop Business Acumen
BI analysts don’t just analyze data, they solve business problems. Understanding your industry’s goals, challenges, and KPIs (key performance indicators) is critical.
How to Build Business Acumen:
Read Industry Reports: Follow McKinsey, Deloitte, or Gartner for insights.
Learn KPIs: For retail, focus on metrics like customer retention rate; for finance, study ROI and risk metrics.
Talk to Stakeholders: Practice translating business needs into data questions.
Real-World Example: At a healthcare startup, BI analyst Priya worked with doctors to track patient readmission rates. Her dashboard helped reduce readmissions by 15%, earning her a promotion.
Step 8: Create a Standout Portfolio
A portfolio showcases your BI analyst skills and makes you stand out to employers. In 2025, 70% of hiring managers prefer candidates with a portfolio over those with just a resume (LinkedIn).
Portfolio Ideas:
Sales Dashboard: Visualize revenue trends for a retail company.
Customer Segmentation: Use Python to segment customers by behavior.
Operational Efficiency: Build a dashboard to track supply chain metrics.
Pro Tip: Host your portfolio on GitHub or a personal website. Include a short write-up explaining your thought process for each project.
Step 9: Network and Join Communities
Networking is a game-changer in the BI world. Engaging with professionals and joining communities can open doors to jobs and mentorship.
Where to Network:
LinkedIn: Connect with BI analysts and share your projects.
Discord/Slack: Join BI-focused communities like DataCamp’s Slack or local meetups.
Conferences: Attend events like Tableau Conference or Microsoft Ignite (virtual options available).
Story: When Maria, a recent BI bootcamp grad, joined a local data analytics meetup, she met a hiring manager who offered her a freelance gig. That gig turned into a full-time role within six months.
Step 10: Ace the Job Application Process
Landing a BI analyst role requires a tailored resume, strong interview skills, and persistence. The job market is competitive, but preparation sets you apart.
Application Tips:
Tailor Your Resume: Highlight SQL, BI tools, and projects. Use action verbs like “optimized” or “visualized.”
Prepare for Interviews: Practice behavioral questions (“Tell me about a time you solved a business problem with data”) and technical ones (SQL queries, dashboard design).
Apply Strategically: Target roles at companies that align with your skills, like startups for Python-heavy roles or enterprises for Tableau expertise.
Pro Tip: Use job boards like Indeed or Glassdoor, but also check company career pages for hidden opportunities.
Common Challenges and How to Overcome Them
The BI analyst roadmap isn’t without hurdles. Here’s how to tackle common ones:
Challenge: Feeling overwhelmed by tools and skills.
Solution: Focus on one skill at a time (e.g., SQL for a month, then Tableau).
Challenge: Lack of experience.
Solution: Build a portfolio with personal projects or volunteer for nonprofits needing data help.
Challenge: Imposter syndrome.
Solution: Connect with peers in BI communities to share struggles and wins.
FAQs
What qualifications do I need to become a BI analyst in 2025?
You don’t need a specific degree, but a background in business, computer science, or statistics helps. Certifications like Microsoft’s Data Analyst Associate or Tableau Desktop Specialist can boost your resume.
How long does it take to become a BI analyst?
With dedicated effort (10-15 hours/week), you can gain the skills needed in 6-12 months. Career-switchers may need longer if starting from scratch.
What are the best business intelligence tools to learn in 2025?
Tableau and Power BI are the most in-demand, followed by Looker and Qlik. Start with one and branch out as you gain experience.
Can I become a BI analyst without coding?
Yes, but learning SQL is non-negotiable. Python or R is a bonus but not always required for entry-level roles.
Final Thoughts
Becoming a BI analyst in 2025 is an exciting journey. By following this BI analyst roadmap, you’ll build the skills, portfolio, and network to land your dream role. Start small, stay consistent, and don’t be afraid to experiment with real-world projects. The data world is waiting for you to go make an impact!


