🛠️ What is a Data Pipeline? A Quick Guide to Building ETL Pipelines with Apache Airflow
In the data-driven world, handling vast amounts of information efficiently is key to unlocking insights and making informed decisions. Data pipelines are the backbone of modern data workflows, automating the process of collecting, transforming, and loading data (ETL). But, what exactly is a data pipeline, and how do we design one?
This guide will walk you through the basics of what a data pipeline is, its key components, and a real-world example using Apache Airflow to orchestrate tasks, all while introducing Directed Acyclic Graphs (DAGs) to streamline your ETL operations.
🔍 What is a Data Pipeline?
A data pipeline is a series of tasks or processes that collect, transform, and store data to achieve a specific result. Think of it as a workflow that moves data from one point to another, ensuring that each step of the process is handled systematically.
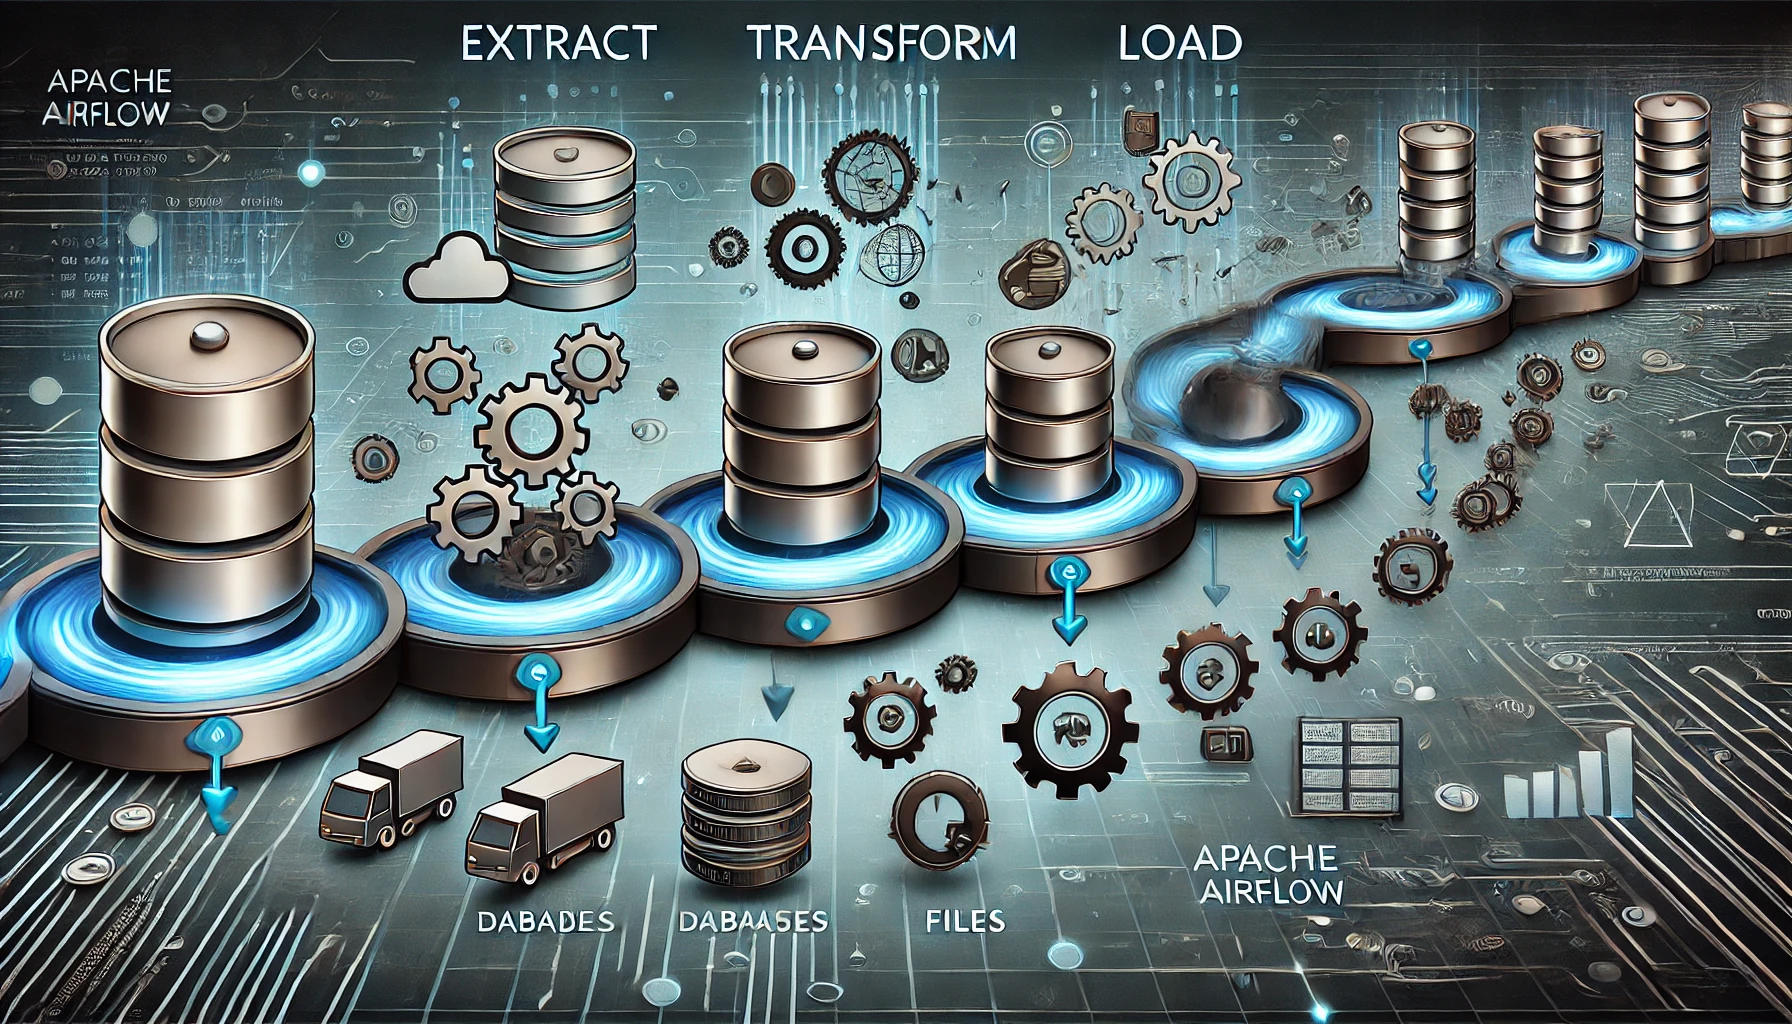
Data pipelines are particularly useful for automating data workflows in ETL (Extract, Transform, Load) processes, where raw data is extracted from various sources, cleaned or transformed, and loaded into a database or dashboard for analysis.
📈 Real-World Example: Weather Dashboard
Imagine we want to build a simple weather dashboard to display the forecast for the upcoming week. Here’s a breakdown of the data pipeline tasks:
Extract: Fetch weather data from an external Weather API.
Transform: Clean or transform the data, such as converting temperatures from Fahrenheit to Celsius or vice versa.
Load: Push the cleaned data to the dashboard for visualization.
These tasks are interconnected, and their execution must follow a specific order to ensure the pipeline works efficiently.
🚦 Key Concepts in Data Pipelines
When building a data pipeline, there are a few important aspects to keep in mind:
Task Order:
Tasks need to be executed in a logical sequence. For instance, you can’t transform data before you’ve fetched it.
After transforming, the data must be pushed to its final destination, such as a dashboard or database.
Dependency Enforcement:
Each task relies on the previous task being completed successfully.
In our weather dashboard example, data cannot be pushed to the dashboard until it has been extracted and transformed.
🧩 Data Pipelines as Graphs
To visualize how a data pipeline works, you can think of it as a graph:
Tasks are represented as nodes (circles).
Dependencies between tasks are represented by directed edges (arrows).
The direction of the edge shows the order in which the tasks must be executed.
This graph is known as a Directed Acyclic Graph (DAG). DAGs ensure that tasks are executed in a specific, non-circular sequence, making them crucial for organizing workflows in data pipelines.
🛠️ Apache Airflow: Orchestrating Data Pipelines
One of the most powerful tools for managing and orchestrating data pipelines is Apache Airflow. It is an open-source platform designed to programmatically author, schedule, and monitor workflows.
🔄 How Airflow Works:
Airflow represents workflows as DAGs.
Each task in the pipeline is a node, and the dependencies between them are edges.
Tasks in an Airflow pipeline are executed according to the order of dependencies defined in the DAG.
In our weather dashboard example, we could use Airflow to orchestrate the following tasks:
Extract weather data using a Python operator.
Transform the data by converting temperature units.
Load the data into a PostgreSQL database.
Visualize the data using a tool like Streamlit.
🧑💻 How to Build a Data Pipeline with Apache Airflow: Weather Dashboard Example
Now that we’ve discussed the concepts, let’s build a basic data pipeline using Apache Airflow.
Step 1: Define the DAG
In Apache Airflow, the DAG defines the order of task execution. Here’s how we define our weather pipeline in a DAG:
					from airflow import DAG
from airflow.operators.python_operator import PythonOperator
from datetime import datetime

# Define the default arguments
default_args = {
    'owner': 'airflow',
    'start_date': datetime(2023, 1, 1),
    'retries': 1
}

# Define the DAG
dag = DAG(
    'weather_dashboard_pipeline',
    default_args=default_args,
    description='A simple ETL weather pipeline',
    schedule_interval='@daily'
)

# Define your tasks
def fetch_weather():
    # Code to fetch weather data from API
    pass

def transform_data():
    # Code to transform the fetched weather data
    pass

def load_data():
    # Code to load data into PostgreSQL
    pass

# Task definitions
extract_task = PythonOperator(
    task_id='fetch_weather',
    python_callable=fetch_weather,
    dag=dag
)

transform_task = PythonOperator(
    task_id='transform_data',
    python_callable=transform_data,
    dag=dag
)

load_task = PythonOperator(
    task_id='load_data',
    python_callable=load_data,
    dag=dag
)

# Set the task dependencies
extract_task >> transform_task >> load_task
Step 2: Fetch Data from Weather API (Extract)
The first task is to fetch the weather data from an API:
					import requests

def fetch_weather():
    url = 'https://api.weatherapi.com/v1/forecast.json?key=YOUR_API_KEY&q=New York&days=7'
    response = requests.get(url)
    data = response.json()
    return data
Step 3: Transform the Data
Once the data is fetched, it needs to be cleaned or transformed before loading it into the database. Here’s how we can convert the temperatures from Fahrenheit to Celsius:
					def transform_data(data):
    for day in data['forecast']['forecastday']:
        # Convert temperature from Fahrenheit to Celsius
        day['day']['temp_c'] = (day['day']['temp_f'] - 32) * 5.0 / 9.0
    return data
Step 4: Load Data into PostgreSQL (Load)
Finally, we push the transformed data into a PostgreSQL database:
					import psycopg2

def load_data(transformed_data):
    conn = psycopg2.connect(database="weather_db", user="postgres", password="password")
    cur = conn.cursor()

    # Example query to insert data into the database
    for day in transformed_data['forecast']['forecastday']:
        cur.execute(
            "INSERT INTO weather (date, temp_c) VALUES (%s, %s)",
            (day['date'], day['day']['temp_c'])
        )

    conn.commit()
    cur.close()
    conn.close()
🎨 Visualizing Data with Streamlit
Once the data is stored in the database, we can use a tool like Streamlit to create a real-time weather dashboard.
					import streamlit as st
import psycopg2

# Connect to PostgreSQL
conn = psycopg2.connect(database="weather_db", user="postgres", password="password")
cur = conn.cursor()

# Query data
cur.execute("SELECT date, temp_c FROM weather")
data = cur.fetchall()

# Create the Streamlit dashboard
st.title("Weather Dashboard")

for row in data:
    st.write(f"Date: {row[0]}, Temperature (Celsius): {row[1]}")

cur.close()
conn.close()
⚙️ Why Use Apache Airflow for Data Pipelines?
Apache Airflow excels in managing complex workflows due to the following features:
Task Scheduling: Automate the execution of tasks on a predefined schedule (e.g., daily or hourly).
Dependency Management: Airflow ensures that tasks are executed in the proper order.
Monitoring: It provides a web interface to monitor tasks, view logs, and troubleshoot errors.
Scalability: Airflow supports complex workflows involving hundreds of tasks.
🛠️ Conclusion: What is a Data Pipeline? A Quick Guide to Building ETL Pipelines with Apache Airflow
A data pipeline is the foundation of modern data engineering, enabling automated ETL workflows that can handle vast amounts of data efficiently. By using tools like Apache Airflow, you can design, schedule, and monitor your data pipelines with ease, ensuring that tasks are completed in the correct sequence.
Whether you’re fetching weather data, transforming it for analytics, or loading it into a database for visualization, data pipelines allow you to manage the flow of information from start to finish.
By applying these principles, you’ll be well-equipped to build robust data pipelines that meet your organization’s needs. 🌟