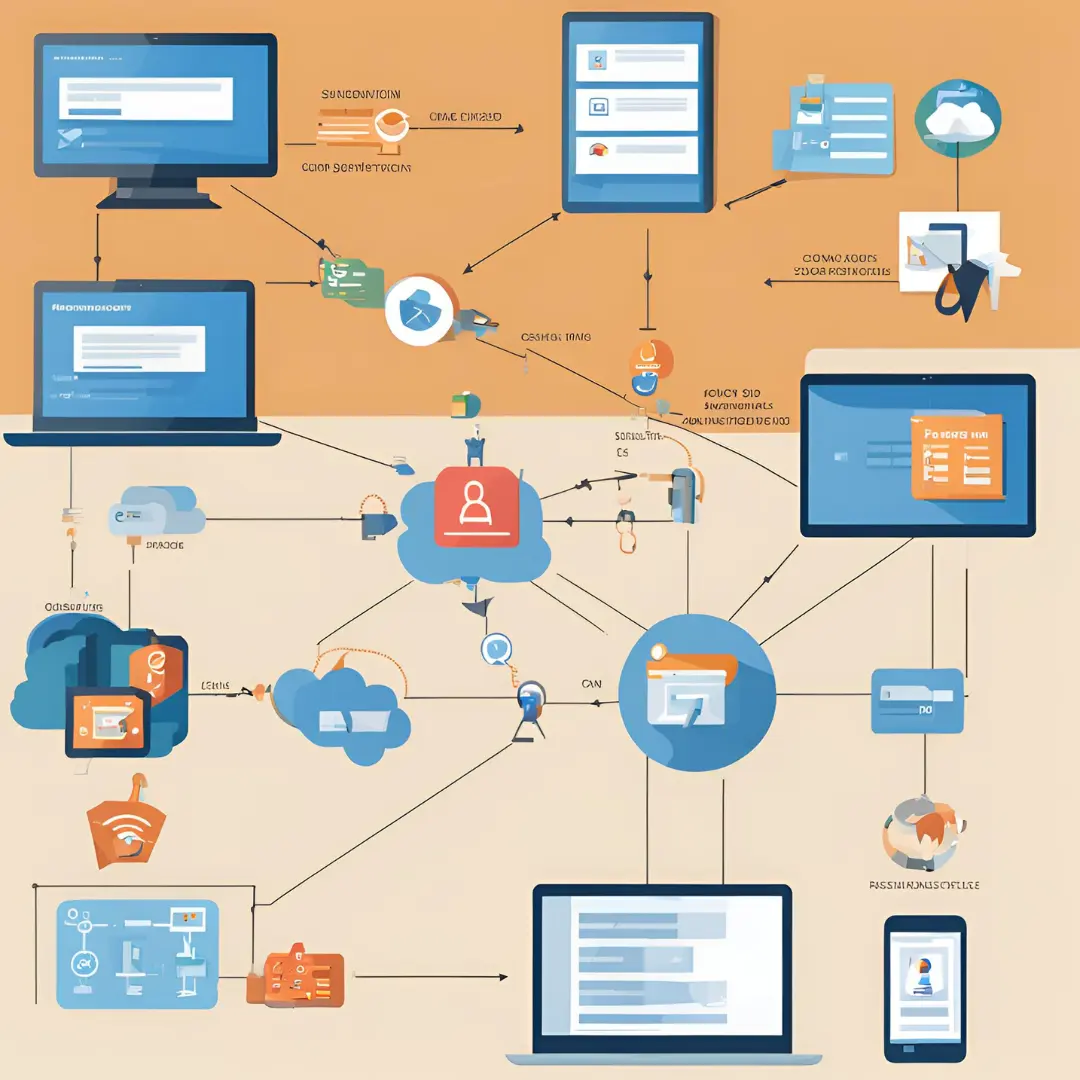
In today’s distributed systems and microservices architecture, achieving full system observability is a critical aspect of ensuring performance, reliability, and issue resolution. Understanding how your system behaves is not merely an option but a necessity, especially when it comes to debugging and performance optimization. This is where the three pillars of observability—Logging Tracing and Metrics—come into play.
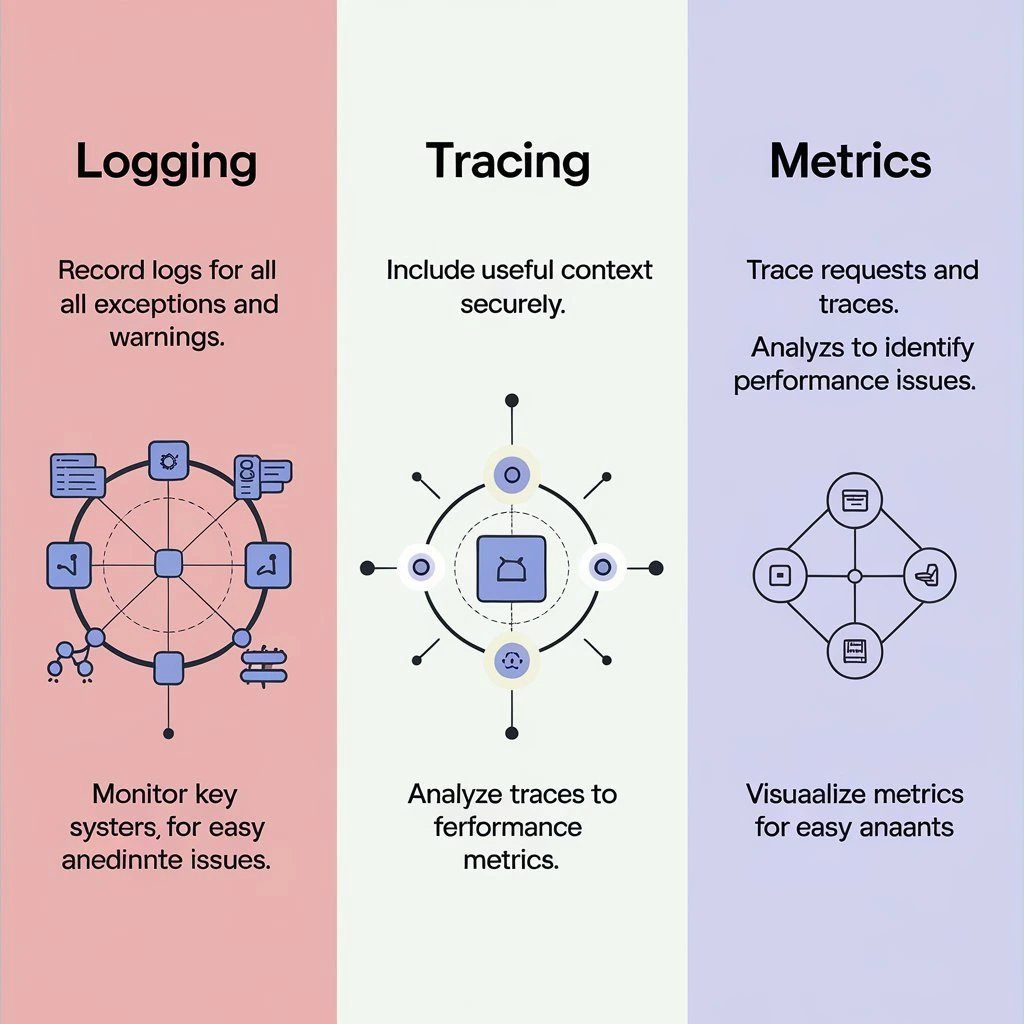
These three elements work together to provide a complete picture of what’s happening inside your system. Without them, it’s like trying to solve a puzzle without having all the pieces. But before we dive into the details, let’s clarify the purpose of each:
-
Logging: Records discrete events like errors, API calls, or database queries.
-
Tracing: Tracks the path of a request through your system, allowing you to pinpoint bottlenecks.
-
Metrics: Captures quantifiable data like system performance, latency, and resource utilization.
Let’s explore these three observability pillars in-depth, their practical implementation, and how they can help you achieve a well-monitored system.
1. Logging: The Event Recorder
Logging is the process of capturing discrete events that occur within a system. Think of logging as keeping a journal where each significant event (like an HTTP request, database access, or error) is recorded for future reference.
Why Logging is Important
High-Volume Data: Logging handles a vast amount of event data at various stages of a system.
Debugging: If a service fails, logs provide a timeline of events leading up to the issue, making it easier to diagnose the root cause.
Searchable Data: Logs can be searched for specific error messages or keywords, enabling quick troubleshooting.
Logging Example
Consider a web service that logs every incoming request, the response time, and whether the database query was successful.
json{ “timestamp”: “2024-09-12T12:34:56Z”, “level”: “INFO”, “message”: “User requested GET /api/products”, “response_time”: “150ms”, “status”: 200 }
Here, the log provides a snapshot of the user request, making it easier to track the flow of the application.
ELK Stack for Logging
The ELK Stack (Elasticsearch, Logstash, and Kibana) is a popular setup for managing and visualizing logs:
Elasticsearch: Indexes and stores logs in a searchable format.
Logstash: Gathers and processes logs from multiple sources.
Kibana: Visualizes log data through interactive dashboards.
Practical Aspects of Logging
Standardized Logging Format: It’s essential to define a consistent format for logs across your services. This allows cross-team collaboration and makes logs easier to parse.
Real-World Scenario: ELK Stack Implementation
In a large e-commerce platform, services like the payment gateway, inventory system, and user authentication generate separate logs. Using the ELK stack, the platform can aggregate logs in a centralized system, making it easier to troubleshoot issues like payment failures or inventory mismatches.
Code Example (Setting up Logstash configuration):
bashinput { file { path => “/var/log/service/*.log” start_position => “beginning” } }
output { elasticsearch { hosts => [“localhost:9200”] index => “logs-%{+YYYY.MM.dd}” } }
2. Tracing: Following the Request Path
Tracing provides visibility into how a request moves through different services within your system. Tracing is particularly valuable for distributed systems, where a single request may touch multiple microservices before being processed.
Why Tracing is Important
End-to-End Visibility: Trace how a user request moves through multiple microservices.
Bottleneck Detection: Identify slow services or high-latency parts of your application.
Performance Optimization: Gain insights into how long each service takes to respond.
OpenTelemetry for Tracing
One of the most popular open-source tools for implementing tracing is OpenTelemetry (OTel). It unifies the three pillars—Logging, Tracing, and Metrics—into a single framework, allowing you to track request paths across your services with ease.
How OpenTelemetry Works:
Instrumentation: The OTel SDK instruments your services to automatically capture traces.
Collector Service: OTel Collectors gather traces from services and forward them to a tracing backend (e.g., Jaeger or Honeycomb.io).
Practical Example of Tracing
Suppose a user makes a request to an online store. The request passes through several services:
- API Gateway
- Load Balancer
- Payment Service
- Inventory Service
- Database
Without tracing, identifying which service is slowing down the request would be challenging. With OpenTelemetry, each service logs a span for that request, and you can view the complete trace in tools like Jaeger or Lightstep.
Tracing Architecture Example
The diagram in the image shows how tracing data from Service A and Service B is collected by an OTel Collector, which then forwards the traces to a platform like Jaeger for visualization.
Example: Trace data collected by OpenTelemetry may look like this:
json{ “trace_id”: “abc123”, “spans”: [ { “span_id”: “def456”, “operation_name”: “payment_service_call”, “start_time”: “2024-09-12T12:34:56Z”, “duration”: “75ms”, “status”: “OK” },
{ “span_id”: “ghi789”, “operation_name”: “inventory_check”, “start_time”: “2024-09-12T12:34:56Z”, “duration”: “120ms”, “status”: “OK” } ] }
This trace shows the duration of the request at each service, helping you identify any performance bottlenecks.
3. Metrics: Quantifying System Performance
Metrics offer quantitative data about your system’s performance. Unlike logging, which captures discrete events, metrics aggregate numeric data like system health, API responsiveness, and service latency.
Why Metrics are Important
Aggregated Data: Metrics provide a high-level view of system performance over time.
Alerting: Metrics can trigger alerts when performance thresholds are breached.
Real-Time Monitoring: Monitor QPS, memory usage, or error rates to maintain system health.
Practical Example of Metrics
Imagine you want to monitor the latency of a payment service. Metrics can track the average response time and compare it against predefined SLAs (Service Level Agreements).
json{ “metric”: “payment_service_latency”, “value”: 200, // milliseconds “timestamp”: “2024-09-12T12:34:56Z” }
If latency exceeds a certain threshold (e.g., 500ms), an alert is sent to the on-call engineer.
Prometheus for Metrics
Prometheus is a popular time-series database used to scrape, aggregate, and store metrics from services. It can trigger alerts based on rules and visualize metrics using Grafana.
Prometheus Workflow:
Scrape: Prometheus pulls metrics data from instrumented services at regular intervals.
Alert: If a metric exceeds a threshold (e.g., CPU usage > 90%), Prometheus sends an alert to Alertmanager.
Visualize: Metrics are displayed in Grafana dashboards for real-time monitoring.
Real-World Scenario: Metrics and Alerts
In a microservices-based web application, you want to ensure your API service has an average latency below 300ms. You can set an alerting rule in Prometheus to notify the team if the latency breaches this value.
Code Example (Prometheus Alerting Rule):
yamlgroups: – name: api_latency_alerts rules: – alert: HighLatency expr: payment_service_latency > 300 for: 5m labels: severity: critical annotations: summary: “High Payment Service Latency Detected” description: “Latency is above 300ms for more than 5 minutes.”
Bringing it All Together: Unified Observability with OpenTelemetry
As seen in the diagram, Logging, Tracing, and Metrics often overlap but serve distinct purposes. By integrating these three, you can achieve comprehensive observability across your system.
Logging helps with event-based investigation.
Tracing provides a request-scope view.
Metrics give a quantitative analysis of performance.
Using OpenTelemetry, you can instrument your services to collect all three observability pillars and send the data to tools like Grafana, Jaeger, and ElasticSearch.

Conclusion: The Importance of Observability in Modern Systems
Achieving full observability through Logging, Tracing, and Metrics is a game-changer for modern applications, especially in distributed systems and microservices. By effectively using these pillars, you can:
-
Quickly debug issues with structured logs.
-
Pinpoint bottlenecks with tracing data.
-
Track performance and set up real-time alerting with metrics.
To ensure your system is highly available, performant, and reliable, it’s crucial to implement these three pillars effectively. OpenTelemetry, paired with visualization tools like Grafana and Kibana, gives you the necessary tools to achieve complete system visibility.
Key Takeaways:
Logs provide event-specific data for troubleshooting.
Traces give end-to-end visibility for request tracking.
Metrics offer real-time quantifiable data for performance monitoring.
Implementing a comprehensive observability strategy will save your team countless hours in debugging and optimize your system’s overall performance.

