


Inside YouTube Recommendation System: How Watch History, CTR, and Satisfaction Signals Drive 70% of Views
A technical breakdown of YouTube recommendation system — from candidate generation via deep neural nets to ranking with satisfaction signals. Essential reading for ML engineers, content strategists, and curious technologists.
Table of Contents
- Think about this
You publish a video. You check the analytics the next morning. The impressions are flat. Not because your content was bad — but because the algorithm never put it in front of the right people. Understanding why that happens is not optional anymore. It’s the difference between growing a channel and disappearing into the noise.
The YouTube recommendation system is responsible for over 70% of all watch time on the platform. Understanding the YouTube algorithm and its underlying machine learning architecture is now essential for growth. That figure, first disclosed in a 2018 TED talk by former product lead Guillaume Chaslot, has become one of the most cited statistics in the history of consumer internet. But what it doesn’t tell you is how the system decides what to surface — and for whom.
This post offers a technically rigorous, example-grounded walkthrough of YouTube’s two-stage deep learning architecture. We’ll cover candidate generation, ranking, watch-time modeling, click-through rate as a noisy signal, and what “satisfaction” actually means to the algorithm. Whether you’re an ML engineer studying recommender systems, a creator trying to understand distribution, or a product manager reasoning about engagement loops — this is written for you.
- Key Insight
YouTube’s recommendation algorithm doesn’t maximize views. It maximizes satisfied watch time — a subtle but critical distinction that shapes everything from thumbnail strategy to video length optimization.
The Two-Stage YouTube Recommendation System Architecture
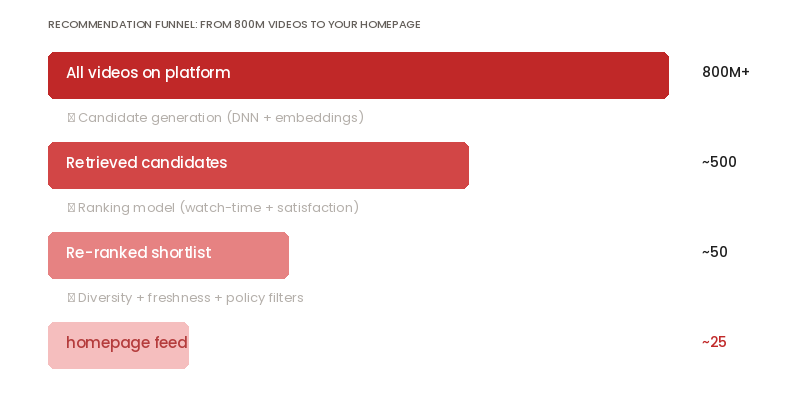
The foundational engineering insight behind the YouTube recommendation system is that the problem is too large for a single model. At any moment, the platform hosts over 800 million videos. Ranking all of them for a single user request is computationally impossible. So YouTube splits the problem into two sequential stages — each doing a different kind of work.
Two-Stage YouTube Recommendation System Pipeline
- Stage 1
- Candidate Generation
- ~500
- videos retrieved from corpus of 800M+
- Deep neural network (DNN)
- User watch history embeddings
- Search query context
- Demographic & geo signals
- High recall, lower precision
- Stage 2
- Ranking
- ~25
- videos surfaced to user homepage
- Rich feature set per video
- Watch time prediction (not CTR)
- Satisfaction signal modeling
- Diversity + freshness constraints
- High precision, personalized
Stage 1: The Candidate Generator Thinks in Embeddings
The candidate generation model treats the problem as extreme multi-class classification. It takes as input a user’s implicit feedback history — specifically the set of video IDs they watched in the last N interactions — and embeds each video into a shared latent space. The user’s “state” is the average of these video embeddings, combined with search query tokens (also embedded) and contextual features like geographic region, device type, and time of day.
The network then learns to predict: “Which video will this user watch next?” The final softmax layer has one class per video in the corpus — but rather than keeping all 800 million classes, YouTube uses approximate nearest-neighbor search (originally using a system they described as a “hash function over video embeddings”) to retrieve the top ~500 candidates efficiently.
What’s elegant about this approach: videos and users exist in the same embedding space. Similarity in that space captures collaborative filtering (users who watched similar things) without explicit user-user comparison. It scales because you only need to embed a user once per request, then do a fast nearest-neighbor lookup.
Stage 2: The Ranking Model Values Time, Not Clicks
Given ~500 candidates, the ranking model re-scores each video with a much richer feature set — including video-specific signals, user-video interaction history, and crucially, a predicted watch time rather than a predicted click probability.
This choice — optimizing for watch time rather than CTR — was one of YouTube’s most consequential algorithmic decisions which changed the overall foundation of the YouTube recommendation algorithm. A video with a misleading thumbnail might generate clicks but delivers low watch time. The ranking model learned to discount these. Watch time is weighted using a technique borrowed from survival analysis: each impression becomes a training example where the “label” is the actual watch time (rather than a binary click/no-click), allowing the model to treat watched videos as positive examples weighted by duration.
- Engineering detail:
The watch time weighting acts as an implicit denoising mechanism. Short watch times (skip or abandon in first 10 seconds) effectively become near-zero-weight negatives, while long-form completion events become high-weight positives. This creates a strong training signal for content quality over thumbnail quality.
Click-Through Rate: Useful Signal, Dangerous Proxy
Ask most creators what matters and they’ll say CTR. They’re right — and dangerously wrong at the same time. CTR is a surface-level intent signal. It tells the algorithm that a thumbnail + title combination generated curiosity. What it doesn’t tell the algorithm is whether that curiosity was satisfied.
CTR vs. Satisfaction — Creator Performance Matrix
- High CTR + High Watch Time
Algorithm favorite. Thumbnail delivers on its promise. Feeds both recall and ranking signals. Channel gets distribution boost.
- Low CTR + High Watch Time
Hidden gem. YouTube’s impression system will test at scale if early satisfaction signals are strong. Organic search often rescues these.
- High CTR + Low Watch Time
Clickbait penalty zone. Initially boosted by impressions, but the ranking model deprioritizes as watch-time data accrues. Can hurt channel authority.
- Low CTR + Low Watch Time
Distribution death spiral. Both signals negative. Algorithm stops serving impressions. Near-impossible to recover without external traffic source.
How the YouTube Recommendation Algorithm Tests CTR: The Impression Experiment
When a new video is uploaded, YouTube doesn’t have watch-time data yet. So it runs what’s functionally an A/B test at the impression level. The system serves the video to a small, warm cohort — users whose watch history makes them likely candidates — and measures CTR first. If CTR clears an initial threshold (not publicly disclosed, but likely ~3–5% as a soft floor), the system expands impressions and begins collecting watch-time data.
This is why the first 24–48 hours of a video’s performance are disproportionately important. The algorithm is gathering the signal it needs to decide whether to push or pull distribution. A slow start doesn’t doom a video permanently — but it creates a credibility gap the algorithm must overcome with later data.
- Before understanding CTR dynamics
Creator obsesses over CTR percentage in isolation, chases sensationalist thumbnails, sees initial spike then sharp drop-off as watch time data degrades ranking.
- After understanding CTR dynamics
Creator designs thumbnails that create accurate expectation, monitors CTR + average view duration together, identifies the “curiosity gap” that doesn’t overpromise.
🤔 THINK
If your CTR is above 6% but your average view duration is below 30% — what does that tell you about the gap between your thumbnail promise and your content delivery?
Satisfaction Signals: What the Algorithm Is Actually Measuring
Watch time tells the algorithm you held someone’s attention. But satisfied watch time goes deeper — it asks whether the viewer left the experience with something. YouTube introduced satisfaction signals formally around 2016–2018, in part as a response to criticism that pure watch-time optimization was amplifying anxiety-inducing and conspiratorial content (which, it turns out, is very “watchable” in a passive, scroll-trap sense but does not produce positive post-watch sentiment).
Satisfaction Signal Hierarchy
| Signal | What it captures | Weight | Notes |
|---|---|---|---|
| Watch time % | Did they stay? | VERY HIGH | Core ranking input; weighted by absolute duration not just % |
| Post-watch survey | “Did you enjoy this?” (1–5) | HIGH | Direct satisfaction proxy; shown to subset of users |
| Likes & shares | Active positive engagement | MEDIUM | Strong signal but low-frequency behavior |
| Subscribe after watch | Future intent signal | MEDIUM | Indicates long-term value delivered |
| Not interested | Don’t recommend | HIGH (NEG) | Explicitly penalizes channel + topic cluster |
| Session continuation | Did they keep watching? | MEDIUM | Exit vs. autoplay next video as session signal |
| Dislikes (pre-2021) | Explicit negative signal | LOW | Hidden from public; still available to algorithm internally |
The Multi-Objective Optimization Problem
Internally, YouTube’s ranking model doesn’t optimize a single metric. It solves a multi-objective optimization problem — balancing engagement signals (watch time, CTR) against satisfaction signals (survey scores, shares) against responsibility signals (avoiding content that performs well in engagement but scores poorly on helpfulness or accuracy). The exact weighting of these objectives is never published, but patents and research papers from YouTube/Google researchers give strong hints about the architecture.
The practical implication for content strategy: a video that maximizes watch time at the expense of viewer satisfaction will surface in the short term but generate negative residue in the system’s user-level model. YouTube builds a per-user “preference vector” that includes not just what they’ve watched, but signals about what they’ve regretted watching. Negative satisfaction data doesn’t just hurt that video — it shapes what the algorithm thinks you’re willing to recommend to that user in the future.
- Practical Takeaways for Content Creators
- Design for completion + reaction , not just clicks. A 12-minute video watched 85% of the way through is worth more than a 3-minute video abandoned at 40%.
- Treat your first 60 seconds as a "retention contract." The algorithm monitors the early drop-off rate specifically — viewers who leave in the first minute are treated as a strong dissatisfaction signal.
- A "like prompt" mid-video isn't just a community engagement technique — it directly nudges a low-frequency but high-weight satisfaction signal. Use it when the viewer has had time to derive value.
- Avoid thumbnail-title combinations that create expectations you can't deliver. The algorithm will eventually correlate your CTR-to-watchtime gap with low satisfaction, even if you temporarily spike impressions.
Watch History and the User Embedding Model
YouTube’s candidate generation model doesn’t treat your watch history as a simple list. It builds a continuous vector representation of your taste — a high-dimensional embedding that captures not just what topics you’ve engaged with, but how you’ve engaged with them. Watch time duration, session context, time elapsed since last watch, and the sequence in which you consumed content all contribute to this embedding.
The model uses an architecture inspired by word2vec — the same principle that learned “king − man + woman = queen” from text sequences. Except here, the “vocabulary” is videos and the “sentences” are watch sessions. Videos watched consecutively share embedding proximity. Channels whose videos you watch in the same sessions tend to cluster together in your personal latent space — even if their surface-level metadata (title, tags, category) looks very different.
The "Exploration vs Exploitation" Tradeoff in Your Feed
A purely exploit-only algorithm would show you the same type of content forever — maximizing short-term engagement at the cost of long-term satisfaction and session diversity. YouTube explicitly builds in exploration terms to the ranking process. A fraction of recommendations — the ratio is not published but estimated at 10–20% by external researchers — are “exploratory” recommendations: videos outside your established taste profile that the system has high prior belief you might like, based on population-level similarities.
This exploration budget is why channels with small but engaged audiences occasionally get sudden, algorithm-driven discovery spikes. The system found a pocket of users whose embeddings were close enough to the channel’s content embedding to make exploration worthwhile. If those new users respond with high satisfaction signals, the channel moves into more users’ “exploitation” zone — generating a compound recommendation loop.
For ML engineers: this is functionally a contextual bandit problem. The algorithm must balance the regret of showing known-good content (safe, bounded reward) against the regret of under-exploring potentially high-reward unknown content. Thompson Sampling and UCB-style approaches have both been described in Google/YouTube research contexts as candidate strategies for this component.
🤔 THINK
If your channel had a sudden discovery spike in a niche you didn’t specifically target — what does that tell you about the latent taste clusters YouTube has mapped your existing audience to?
People Also Ask: Cutting Through Common Misconceptions
Does watch history permanently define what the algorithm recommends to you?
Not permanently. YouTube’s user embedding model uses a recency-weighted moving window — recent watch sessions carry more weight than sessions from months ago. This is by design: the algorithm assumes interests drift, and a purely historical model would trap users in content they’ve grown past. Long inactivity periods cause the model to partially reset toward population-level defaults until fresh signals rebuild a personalized profile
Why do some videos get massive algorithmic push while others with similar quality get ignored?
The candidate generation model depends on a bootstrapping problem: new videos with no watch-time history can’t be embedded accurately in the latent space. YouTube partially addresses this by using channel-level embeddings as a prior — meaning a new video from a well-performing channel inherits some of that channel’s embedding proximity, giving it a headstart in the candidate pool. A new channel uploading its first video has no such prior, which is why distribution for new creators depends heavily on seed traffic from external sources (search, social) that generates early watch-time data.
How does YouTube handle "binge-watching" and the concern about over-engagement?
Since approximately 2019, YouTube has published that it introduced “regret” as a training signal. Post-watch surveys now include variants of “do you regret watching this?” alongside simple satisfaction ratings. The system uses this to identify content that generates passive, hard-to-stop-watching behavior but low post-session satisfaction — a pattern associated with anxiety, controversy, and rabbit-hole dynamics. Videos with high regret signals get deprioritized in session-continuation recommendations specifically, even if their raw watch time is high.
Does uploading frequency directly impact algorithmic distribution?
Indirectly, yes. YouTube doesn’t have a direct “upload frequency” feature in its ranking model. But frequent uploading generates more training data for the channel’s embedding, maintains a channel’s presence in subscribers’ recommendation windows (since those are recency-weighted), and provides more opportunities for the candidate generation model to discover new high-performing content clusters within the channel’s topic space. Consistency matters most at early channel stages; at scale, video quality and satisfaction signals dominate.